Introduction: Understanding the Symptom
If you’ve worked with Kubernetes for any length of time, you’ve encountered the dreaded CrashLoopBackOff status. But here’s the critical insight that will transform your debugging approach: CrashLoopBackOff is not an error—it’s a symptom.
When you see a pod in CrashLoopBackOff state, what you’re actually witnessing is Kubernetes’ control loop responding to a container that’s repeatedly starting, crashing, and restarting. The pod status is merely reporting this cycle, not the underlying cause.
The BackOff Mechanism Explained
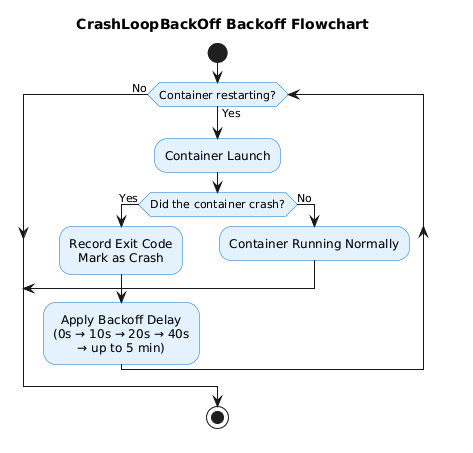
The “BackOff” portion of CrashLoopBackOff refers to the kubelet’s exponential backoff strategy. When a container fails:
- First restart: Immediate
- Second restart: 10-second delay
- Subsequent restarts: Exponentially increasing delays (20s, 40s, 80s, etc.)
- Maximum delay: Capped at 5 minutes
This mechanism prevents a failing container from overwhelming your cluster with rapid restart attempts. The kubelet implements this backoff to give transient issues time to resolve while conserving cluster resources.
Critical insight: If your pod has reached CrashLoopBackOff status, it means several steps have already succeeded—the image was pulled, the pod was scheduled, and the container started. The failure is happening inside the container’s runtime execution.
Now let’s walk through the systematic approach to finding the real culprit.
Step 1: Surveying the Crime Scene (kubectl describe pod)
Your first investigative tool is kubectl describe pod. This command provides a comprehensive snapshot of the pod’s lifecycle, resource configuration, and recent events.
kubectl describe pod <pod-name> -n <namespace>
What to Look For
Focus on two critical sections:
1. The Last State Section
Containers:
  my-app:
    State:          Waiting
      Reason:       CrashLoopBackOff
    Last State:     Terminated
      Reason:       Error
      Exit Code:    137
      Started:      Mon, 10 Dec 2025 10:45:32 +0530
      Finished:     Mon, 10 Dec 2025 10:45:35 +0530
The Last State is your smoking gun. Here’s what matters:
- Reason: Usually “Error” or “OOMKilled”
- Exit Code: This is the key to diagnosing the root cause (we’ll decode this in Step 2)
- Finished – Started: Shows how long the container ran before crashing
2. The Events Section
Events:
  Type     Reason     Age                  Message
  ----     ------     ----                 -------
  Normal   Pulling    5m (x4 over 6m)      Pulling image "nginx:latest"
  Normal   Pulled     5m (x4 over 6m)      Successfully pulled image
  Normal   Created    5m (x4 over 6m)      Created container
  Normal   Started    5m (x4 over 6m)      Started container
  Warning  BackOff    2m (x8 over 4m)      Back-off restarting failed container
Events reveal high-level patterns:
- Restart frequency (
x4 over 6mindicates 4 restarts in 6 minutes) - Probe failures (
Liveness probe failed: HTTP probe failed) - Resource warnings (
OOMKilledappears here for memory issues)
Architecture Note: The kubelet writes these events to the Kubernetes API server’s event stream. They’re ephemeral (typically retained for 1 hour) and provide a chronological audit trail of pod lifecycle operations.
Step 2: Decoding the Exit Code (The Root Cause Map)
The exit code is your container’s final message to the kubelet. Understanding these codes immediately narrows your investigation scope.
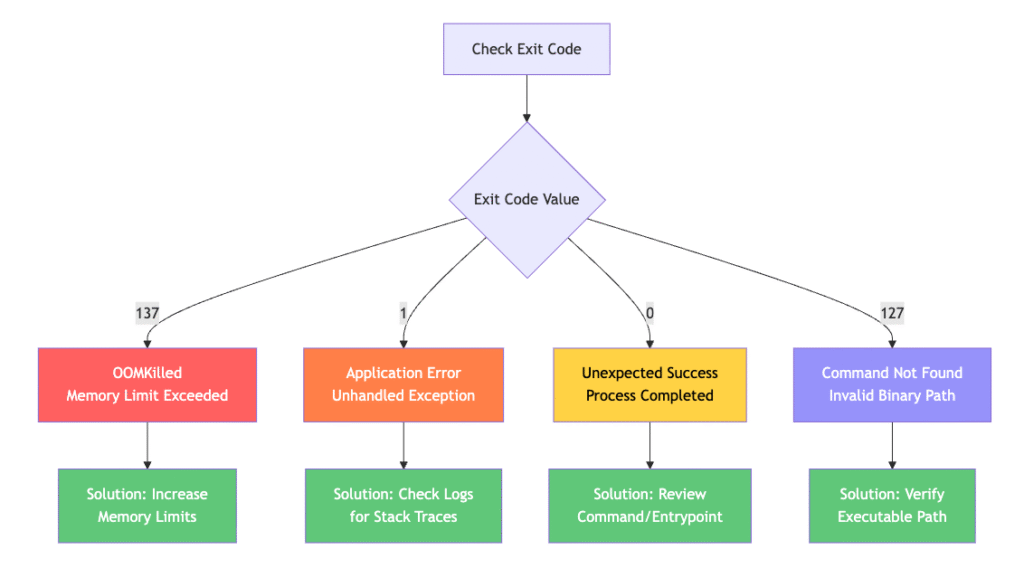
Exit Code 137: SIGKILL / OOMKilled
Meaning: The container was forcibly terminated by the kernel’s Out-of-Memory (OOM) killer.
Why it happens: Your container exceeded its memory limit defined in the pod spec:
resources:
  limits:
    memory: "128Mi"  # Container tried to use more than this
  requests:
    memory: "64Mi"
The Fix:
resources:
  limits:
    memory: "512Mi"  # Increased limit
  requests:
    memory: "256Mi"  # Increased request
Pro tip: Use kubectl top pod <pod-name> to monitor real-time memory usage before adjusting limits.
Exit Code 1: General Application Error
Meaning: The application exited with a non-zero status due to an unhandled exception, configuration error, or application bug.
Common causes:
- Uncaught exceptions in your application code
- Missing dependencies or libraries
- Invalid configuration files
- Connection failures to databases or external services
The Fix: Proceed immediately to Step 3 to examine application logs.
Exit Code 0: Unexpected Successful Exit
Meaning: The container’s main process completed successfully and exited cleanly.
Why this causes CrashLoopBackOff: For long-running applications (Deployments, StatefulSets), exit code 0 is unexpected. Kubernetes expects these containers to run indefinitely.
Common causes:
# Problem: Shell script completes execution
command: ["/bin/sh"]
args: ["-c", "echo 'Hello World'"]  # Runs and exits immediately

# Solution: Keep process running
command: ["/bin/sh"]
args: ["-c", "echo 'Starting app' && exec /usr/local/bin/app"]
Exit Code 127: Command Not Found
Meaning: The specified command or binary doesn’t exist in the container’s filesystem.
# Problem: Typo in command
command: ["/usr/bin/ngins"]  # Should be "nginx"

# Solution: Fix the path
command: ["/usr/sbin/nginx"]
Step 3: Finding the Smoking Gun (kubectl logs --previous)
This is where most engineers make a critical mistake. Running kubectl logs <pod-name> often returns empty output or logs from a container that hasn’t crashed yet.
The crucial flag: --previous
kubectl logs <pod-name> --previous -n <namespace>
The --previous flag retrieves logs from the previous container instance—the one that actually crashed. This is where you’ll find:
- Stack traces from application errors (Exit Code 1)
- Connection timeout errors
- Configuration parsing failures
- Authentication/authorization errors
Example output:
$ kubectl logs backend-api-7d4f6c8b9-xkl2m --previous

panic: runtime error: invalid memory address or nil pointer dereference
goroutine 1 [running]: main.connectDatabase(0x0, 0x0, 0x0) /app/main.go:45 +0x2b main.main() /app/main.go:23 +0x8f
This stack trace immediately tells you the application crashed at line 45 in main.go due to a nil pointer—likely a missing database configuration.
Common Root Causes and Quick Fixes
1. Misconfigured Application Command
Symptom: Exit Code 0, 127, or 1 shortly after container start
Example Problem:
containers:
- name: app
  image: myapp:latest
  command: ["/bin/bash"]
  args: ["-c", "echo 'Done'"]  # Completes immediately
Solution:
containers:
- name: app
  image: myapp:latest
  command: ["/usr/local/bin/myapp"]
  args: ["--config", "/etc/config/app.yaml"]  # Long-running process
2. Failing Liveness/Readiness Probes
Symptom: Container runs fine initially, then gets killed by kubelet
Example Problem:
livenessProbe:
  httpGet:
    path: /health
    port: 8080
  initialDelaySeconds: 5  # App needs 30s to start!
  periodSeconds: 10
  timeoutSeconds: 1
  failureThreshold: 3
Your application takes 30 seconds to initialize, but the liveness probe starts checking after only 5 seconds. After 3 failures (30 seconds total), kubelet kills the container.
Solution:
livenessProbe:
  httpGet:
    path: /health
    port: 8080
  initialDelaySeconds: 45  # Give app time to start
  periodSeconds: 10
  timeoutSeconds: 5        # Increased timeout
  failureThreshold: 3
3. Missing Configuration or Secrets
Symptom: Exit Code 1 with configuration parsing errors in logs
Example Problem:
env:
- name: DATABASE_PASSWORD
  valueFrom:
    secretKeyRef:
      name: db-secret
      key: password  # Secret doesn't exist!
Solution:
# Create the missing secret
kubectl create secret generic db-secret \
  --from-literal=password='MySecurePassword123' \
  -n <namespace>
4. Resource Constraints (Memory/CPU)
Symptom: Exit Code 137 (OOMKilled) or throttled performance
Diagnostic Command:
kubectl top pod <pod-name> -n <namespace>
Solution Architecture:
resources:
  requests:
    memory: "256Mi"  # Guaranteed allocation
    cpu: "250m"
  limits:
    memory: "512Mi"  # Maximum allowed
    cpu: "500m"
Important: The request value determines scheduling (which node can host this pod). The limit value determines when the container gets killed (memory) or throttled (CPU).
Troubleshooting Flow Diagram
Conclusion: The Systematic Approach
CrashLoopBackOff will cease to be intimidating once you understand it’s merely a symptom reporting mechanism. By following this three-step troubleshooting flow—describe, decode, and diagnose—you’ll identify root causes in minutes rather than hours.
Key takeaways:
- Always start with
kubectl describe podto get exit codes and events - The exit code is your diagnostic compass—it tells you exactly where to look
- The
--previousflag is non-negotiable when examining logs - Resource limits and probes are the most common misconfigurations in production environments
The next time you encounter a pod in CrashLoopBackOff, remember: it’s not the problem—it’s telling you where to find the problem.
Have you encountered a unique CrashLoopBackOff scenario? Share your experience in the comments below! If this guide helped you resolve an issue, please share it with your team.