Kubernetes Chaos: When Every Command Throws the Same Error
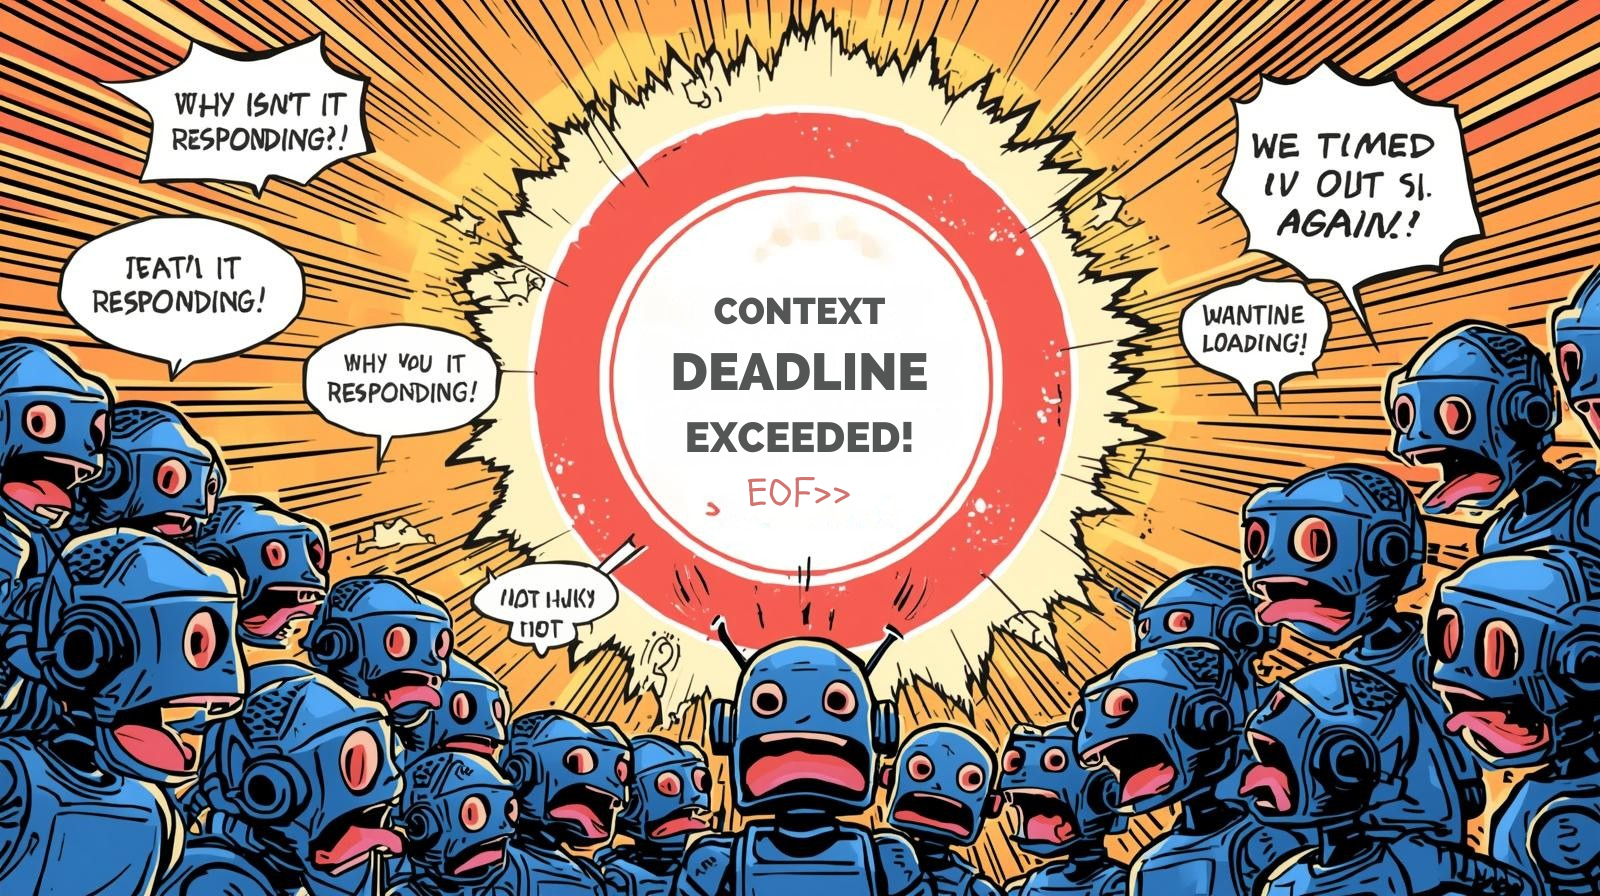
Imagine your company’s major services that run on microservices and all of them are down. Every kubectl command returns the same cryptic error:
$ kubectl get pods -n production
Error from server: Get "https://10.20.30.40:6443/api/v1/namespaces/production/pods":
context deadline exceeded
Our entire deployment pipeline was frozen. Developers couldn’t ship code. Monitoring dashboards showed blank screens. And worst of all? I had no idea where to start.
That incident taught me everything I know about this particular Kubernetes nightmare. Let me save you the 4 hours of panic I went through.
What “Context Deadline Exceeded” Really Means (In Plain English)
Think of it like calling customer service and being put on hold forever until the line disconnects. Your kubectl command (the caller) is waiting for the Kubernetes API server (customer service) to respond, but it takes so long that the connection times out.
Translation: The Kubernetes control plane is either overloaded, stuck, or can’t reach its database (ETCD) fast enough.
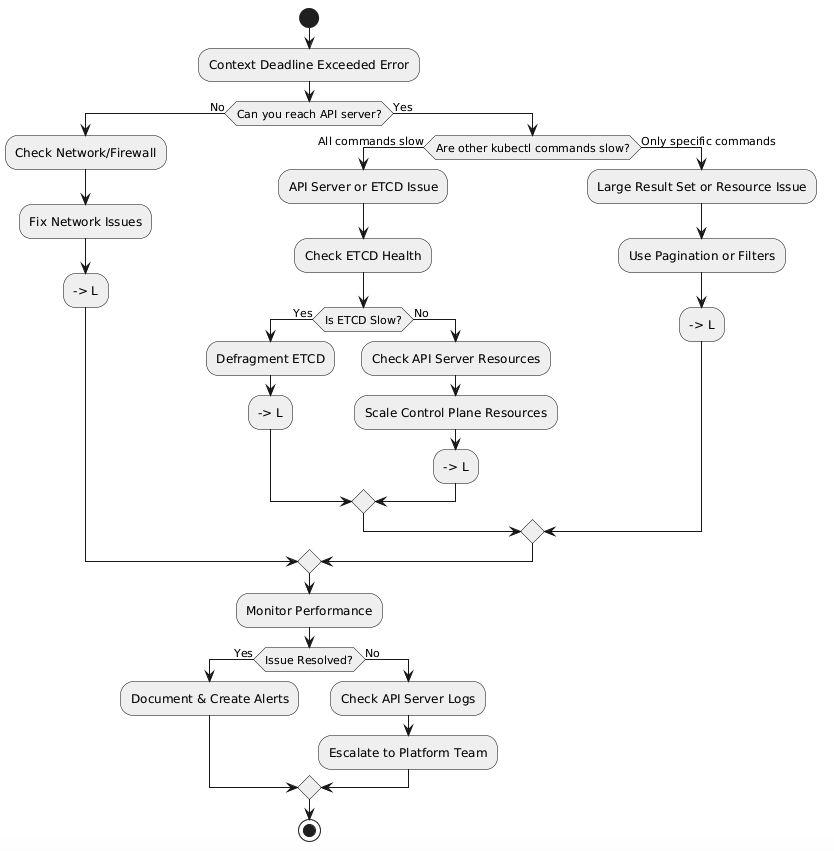
My Troubleshooting Journey: A Flowchart That Would’ve Saved Me Hours
Here’s the exact decision tree I now follow (wish I had this that night):
The Real Culprit: ETCD Was Choking (And Here’s Why)
After checking the basics, I discovered our ETCD database had ballooned to 8GB. For context, it should typically stay under 2GB. Every API request was taking 5-10 seconds instead of milliseconds.
The Diagnosis:
$ kubectl exec -n kube-system etcd-master-1 -- etcdctl endpoint status --write-out=table

+------------------+------------------+---------+---------+-----------+------------+
|     ENDPOINT     |        ID        | VERSION | DB SIZE | IS LEADER | RAFT TERM  |
+------------------+------------------+---------+---------+-----------+------------+
| 127.0.0.1:2379   | 8e9e05c52164694d | 3.5.9   | 8.1 GB  | true      | 2          |
+------------------+------------------+---------+---------+-----------+------------+

# Response time: 8.2 seconds
The Fix That Saved Our Night (Step-by-Step)
Step 1: Increase Timeout (Quick Workaround)
# Buy yourself some breathing room
kubectl config set-context --current --request-timeout=60s
Result: Commands started working again, but slowly. At least I could see what was happening.
Step 2: Defragment ETCD (The Game Changer)
This is where things got interesting. ETCD fragmentation was the smoking gun.
# Before defragmentation
$ kubectl exec -n kube-system etcd-master-1 -- etcdctl defrag
Defragmenting member[127.0.0.1:2379]
Finished defragmenting etcd member[127.0.0.1:2379]

# Check database size after
$ kubectl exec -n kube-system etcd-master-1 -- etcdctl endpoint status --write-out=table
+------------------+------------------+---------+---------+-----------+------------+
|     ENDPOINT     |        ID        | VERSION | DB SIZE | IS LEADER | RAFT TERM  |
+------------------+------------------+---------+---------+-----------+------------+
| 127.0.0.1:2379   | 8e9e05c52164694d | 3.5.9   | 2.3 GB  | true      | 2          |
+------------------+------------------+---------+---------+-----------+------------+

# Response time: 340ms
Step 3: Compact ETCD History
# Remove old revision history
$ kubectl exec -n kube-system etcd-master-1 -- etcdctl compact \
  $(kubectl exec -n kube-system etcd-master-1 -- etcdctl endpoint status \
  --write-out="json" | jq -r '.[0].Status.header.revision')

compacted revision 2847593
Performance Benchmarks: The Numbers Don’t Lie
Here’s what changed after the fix:
MetricBefore FixAfter FixImprovementETCD DB Size8.1 GB2.3 GB72% reductionAPI Response Time5-10 seconds200-400ms95% fasterkubectl get podsTimeout (60s+)1.2sSuccess!Deployment TimeFailed45s avgPipeline restoredCPU Usage (Control Plane)85%32%53% reduction
The Root Cause: What We Did Wrong
Our cluster had accumulated thousands of old events and completed pods over 6 months without cleanup. Every API query had to sift through this garbage.
The smoking gun:
$ kubectl get events --all-namespaces --sort-by='.metadata.creationTimestamp' | wc -l
47,293 events

$ kubectl get pods --all-namespaces --field-selector=status.phase=Succeeded | wc -l
3,847 completed pods (just sitting there!)
Lessons Learned & Prevention Strategy
1. Automated ETCD Maintenance (Set It and Forget It)
I created a monthly CronJob that runs defragmentation during low-traffic hours:
apiVersion: batch/v1
kind: CronJob
metadata:
  name: etcd-defrag
  namespace: kube-system
spec:
  schedule: "0 2 1 * *"  # 2 AM on 1st of every month
  jobTemplate:
    spec:
      template:
        spec:
          containers:
          - name: etcd-defrag
            image: bitnami/etcd:3.5.9
            command:
            - /bin/sh
            - -c
            - |
              etcdctl defrag --cluster
              etcdctl compact $(etcdctl endpoint status --write-out="json" | jq -r '.[0].Status.header.revision')
2. Resource Cleanup Script
#!/bin/bash
# cleanup-old-resources.sh
# Runs weekly via cron

# Delete old events (older than 7 days)
kubectl delete events --field-selector \
  metadata.creationTimestamp<$(date -d '7 days ago' -Iseconds) -A

# Delete completed/failed pods (older than 24 hours)
kubectl delete pods --field-selector=status.phase=Succeeded -A
kubectl delete pods --field-selector=status.phase=Failed -A
3. Monitoring That Actually Alerts You
I set up Prometheus alerts for ETCD size and API latency:
- alert: ETCDDatabaseSizeHigh
  expr: etcd_mvcc_db_total_size_in_bytes > 5e9  # 5GB
  for: 15m
  annotations:
    summary: "ETCD database size is > 5GB"

- alert: APIServerSlowResponse
  expr: apiserver_request_duration_seconds{quantile="0.99"} > 5
  for: 5m
  annotations:
    summary: "API server 99th percentile latency > 5s"
Final Thoughts: You’re Not Alone
This incident taught me more about Kubernetes internals than any certification exam. The “context deadline exceeded” error isn’t a death sentence—it’s just Kubernetes telling you something needs attention.
Have you dealt with this error before? What worked for you? Drop your war stories in the comments below—I’d love to hear how others have tackled this beast.
Further Reading:
Keywords: kubernetes context deadline exceeded, kubernetes timeout error, kubectl timeout fix, kubernetes api server troubleshooting, etcd performance kubernetes